Multiple Choice
Identify the
choice that best completes the statement or answers the question.
|
|
|
1.
|
What kind of data is the following?
The heights of basketball
players.
A | numerical: discrete | B | numerical: continuous | C | categorical:
nominal | D | categorical: ordinal | E | None of the
above |
|
|
|
2.
|
The following incomplete two-way table describes a gardener’s experiment
with two fertilisers. She adds fertiliser A to some plants and fertiliser B to the other plants. She
then compares the different numbers of tomatoes produced by the two sets of plants. How many
plants using fertiliser B produced twenty or less tomatoes? | | Number of fruit | | | | 0-20 | 21-40 | 41+ | Total | Fertiliser A used | 6 | 18 | | 41 | Fertiliser B
used | | | | 49 | Total: | | 42 | 34 | | | | | | |
|
|
|
3.
|
Students at different year levels are asked their future choice of career. The
results are summarised in the table below. Work type | Year 7-8 | Year 9-10 | Year
10-12 | | Trade | 18 | 9 | 7 | | Clerical | 3
| 7 | 8 | | Manual | 14
| 8 | 4 | | Professional | 14 | 13 | 17 | | | | |
What percentage of Year 7-8 students would like a manual type of
career?
|
|
|
4.
|
Students at different year levels are asked their future choice of career. The
results are summarised in the table below. Work type | Year 7-8 | Year 9-10 | Year
10-12 | | Trade | 16 | 9 | 7 | | Clerical | 3
| 7 | 8 | | Manual | 14
| 8 | 4 | | Professional | 14 | 13 | 17 | | | | |
If a student from the school is chosen at random, what is the
probability they are in Year 9-12 and would like a clerical career?
|
|
|
5.
|
A false positive is a
A | positive result that is wrong. | B | positive result that is
correct. | C | negative result that is wrong. | D | negative result that is
correct. | E | negative result that may be correct. |
|
|
|
6.
|
A test for a certain disease is correct 91% of the time. The disease occurs in
3% of the population. Display this information in a two-way table. Use this table to find the
probability that
(a) You will not have the disease and be diagnosed that you have it.
(b)
You will have the disease but be diagnosed as not having it.
A | (a) 3%
(b) 9% | B | (a) 9%
(b) 3% | C | (a) 0.27%
(b)
8.73% | D | (a) 8.73%
(b) 0.27% | E | (a) 91%
(b)
91% |
|
|
|
7.
|
What kind of a relationship could be concluded between the x and y
variables from the scatter plot below? 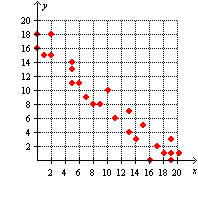 A | No relationship | B | Weak positive | C | Weak
negative | D | Strong positive | E | Strong negative |
|
|
|
8.
|
The covariance of x and y is –144.12 and their standard
deviations are 17.806 and 11.906 respectiviely. What is their correlation coefficient?
A | –0.70 | B | –0.68 | C | 0.68 | D | –0.66 | E | 0.66 |
|
|
|
9.
|
When a scatterplot is drawn, the points form a perfect straight line with
gradient  . What is the correlation coefficient? A | 0 | B | –1 | C | 1 | D |  | E |  |
|
|
|
10.
|
Calculate Pearson’s correlation coefficient for the data in the table
below. x | 21 | 8 | 49 | 40 | 41 | 56 | 10 | 26 | 46 | 19 | y | 24 | 10 | 21 | 43 | 37 | 46 | 8 | 29 | 11 | 20 | | | | | | | | | | | |
A | –0.68 | B | 0.64 | C | –0.64 | D | 0.61 | E | –0.61 |
|
|
|
11.
|
A student compared two variables, calculating the correlation coefficient to be
–0.27. This means there is ...
A | no relationship | B | a weak negative relationship | C | a moderate negative
relationship | D | a strong negative relationship | E | a perfect negative
relationship |
|
Problem
|
|
|
12.
|
In two different clubs, the membership was broken down according to age groups
as follows. Display the data in a two-way
table.
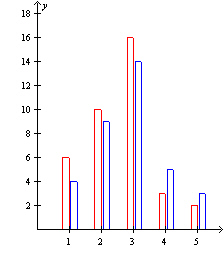
Group 1: Aged
15-17
Red: Frangipani
Club
Group 2: Aged
18-21
Blue: Ironing
Club
Group 3: Aged
22-29
Group 4: Aged
30-35
Group 5: Aged 36+
|